viernes, 9 de noviembre de 2012

17 formas de visualizar tu red de Twitter


17 Ways to Visualize the Twitter Universe


Flowing data


17 Ways to Visualize the Twitter Universe
I just created a new Twitter account, and it got me to thinking about all the data visualization I've seen for Twitter tweets. I felt like I'd seen a lot, and it turns out there are quite a few. Here they are grouped into four categories - network diagrams, maps, analytics, and abstract.

Network Diagrams

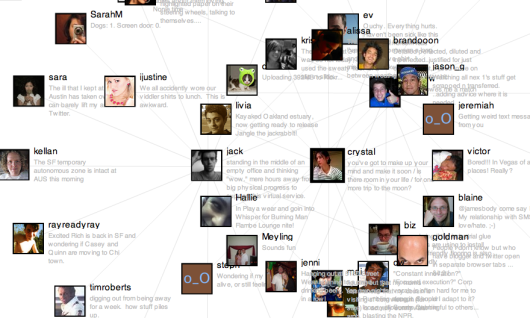
Twitter is a social network with friends (and strangers) linking up with each other and sharing tweets aplenty. These network diagrams attempt to show the relationships that exist among users.

Twitter Browser

Twitter Browser

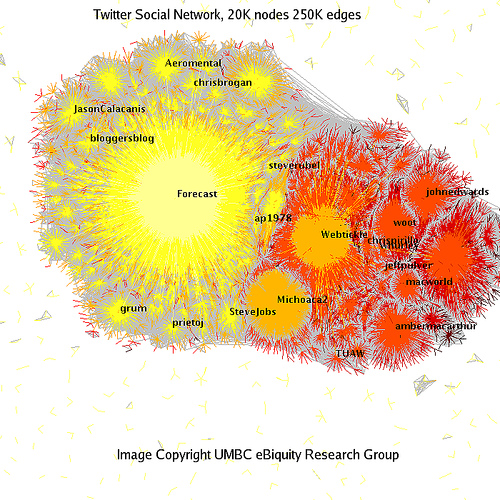
Twitter Social Network Analysis

The ebiquity group did some cluster analysis and managed to group tweets by topic.
Twitter Social Network Analysis

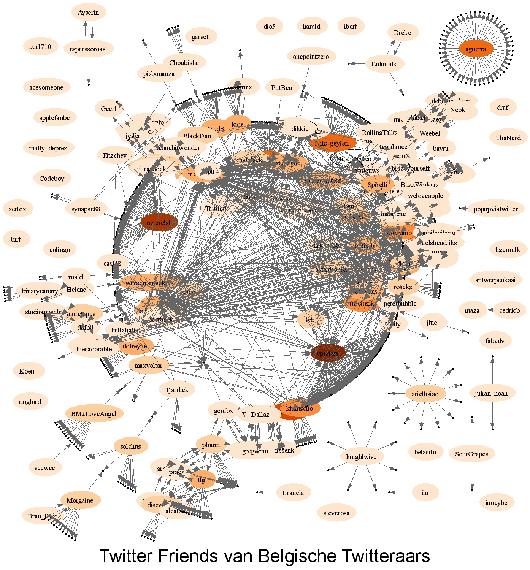
Twitter Vrienden

Twitter Vrienden

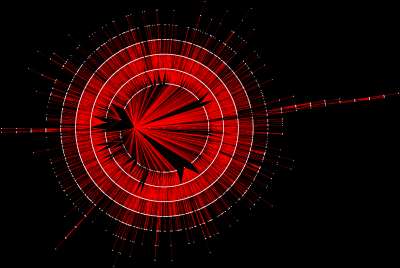
Twitter in Red

I'm not completely sure how to read this one. I looks like it starts from a single user and then shoots out into the network.
Twitter in Red

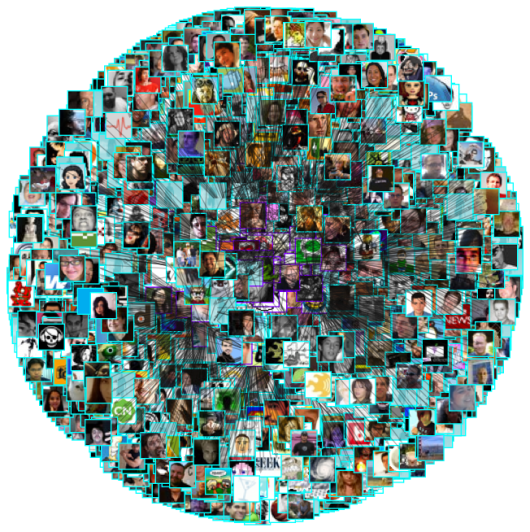
Twitter Network

Twitter Network

Maps

When you create a Twitter account, you can enter where you are located, so in my case, I put New York. Because Tweets often have location attached to them, maps naturally lend themselves to tweet visualization.

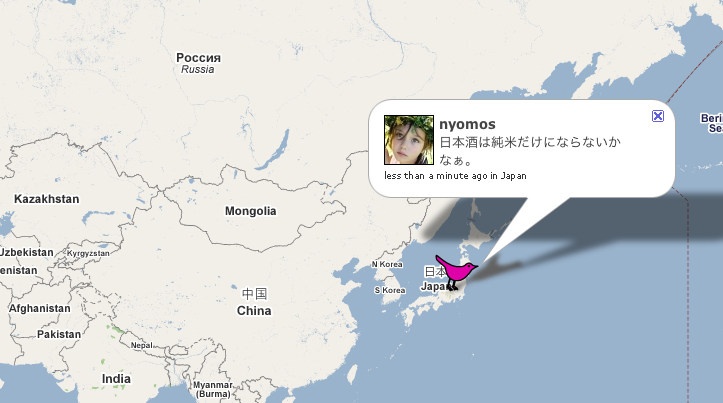
TwiterVision

Yeah, it's a Google Maps mashup, but a bit better than what you're used to seeing.
TwitterVision

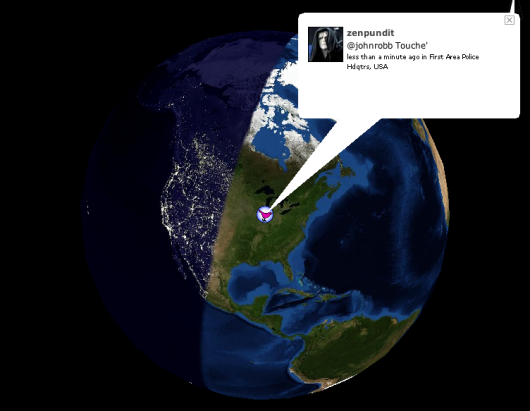
TwitterVision3d

It's TwitterVision taken to the next dimension.
TwitterVision 3D

Analytics

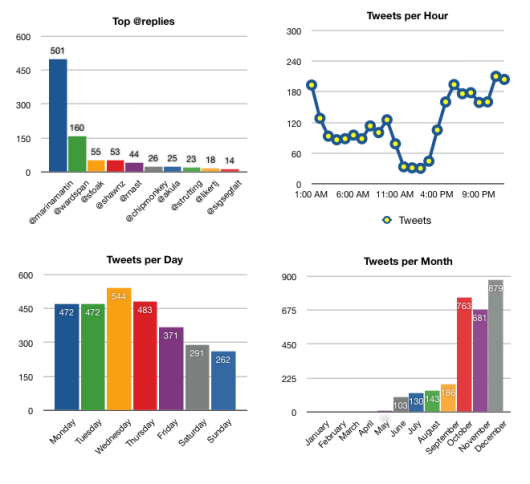
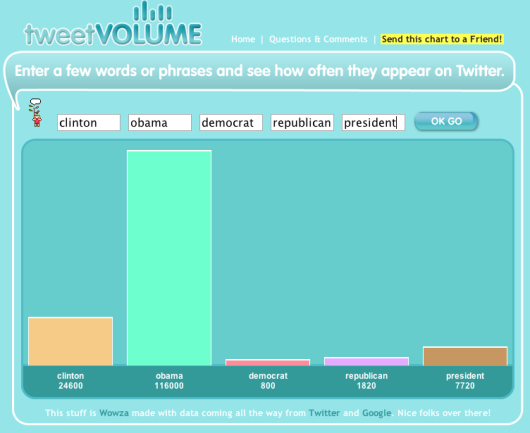
Maybe you don't care so much about the relationships or locations, but what you're really after is what everyone is Twittering about. These analytic visualization serve as a Twitter zeitgeist.

TweetStat

TweetStat

TweetVolume

TweetVolume

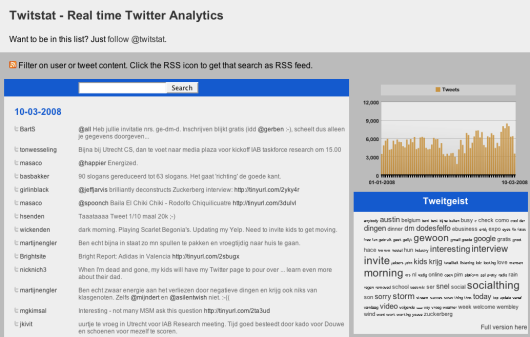
TwitStat

TwitStat

TwitterMeter

TwitterMeter

Abstract

They're not quite maps, not quite network diagrams, and not quite analytic tools. Rather they all follow some metaphor and encourage exploration.

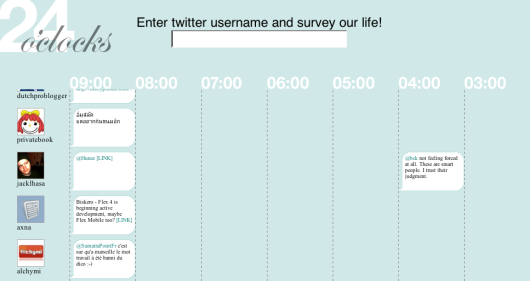
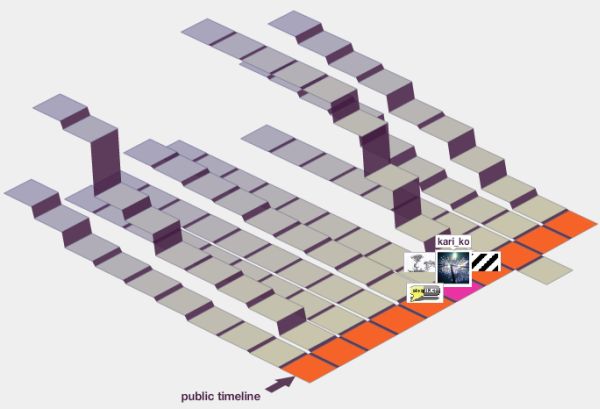
24 o'clocks

Is it just me, or does this sound like a really good name for a band?
24 oclocks

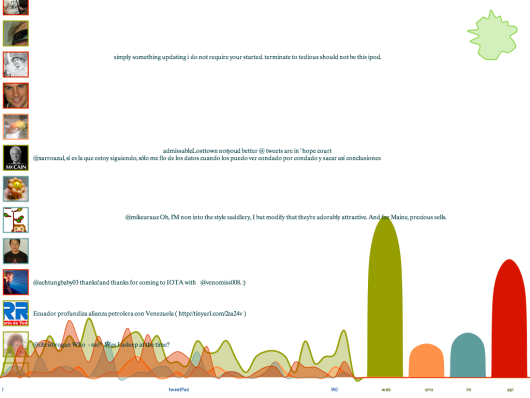
TweetPad

Created at the Visualizar workshop, it's actually more than just curves. In fact the blobbies are meant more for background while the main event is playing with the tweets.
TweetPad

Twitter Fountain

Twitter Fountain

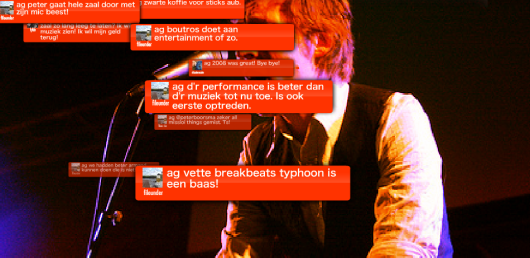
Twitter Blocks

Created by the folks at Stamen. I posted about Blocks when it came out.
Twitter Blocks

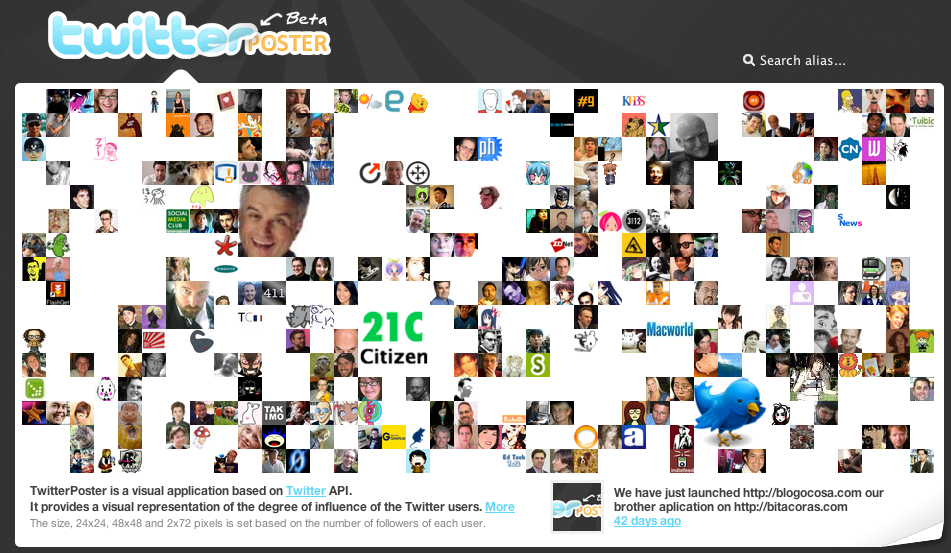
TwitterPoster

TwitterPoster

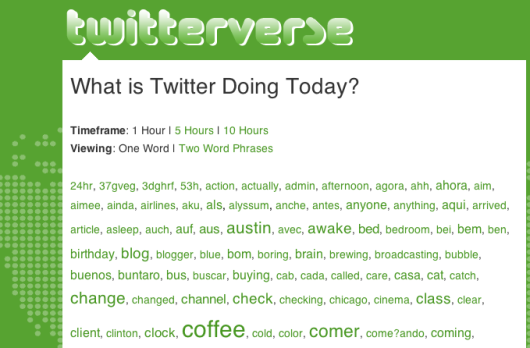
TwitterVerse

TwitterVerse
A lot, huh? All of these were made possible by the Twitter API that allows developers to access Twitter data for free. Did I miss any other Twitter visualizations? Please leave the link in the comments below.

Follow Me On Twitter

So now that you know what Twitter looks like, you can head on over and "follow" me; or if you don't have an account yet, you can create one in a few seconds.
If you don't know what Twitter is or wondering what the point is, here's a short video explaining Twitter in "plain English."


jueves, 8 de noviembre de 2012

Minería en Twitter usando NodeXL


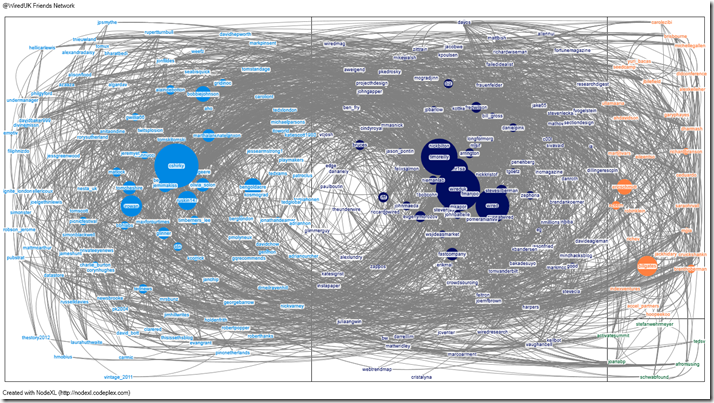
Twitter network analysis and visualisation II: NodeXL – Getting started with the @WiredUK friends network


The other tool that I got wind of just after SocialBro was Network Overview, Discovery and Exploration for Excel – NodeXL . As indicated in the title NodeXL is an add-on for Microsoft Excel (Windows version) but the code is free and open source. Here’s the description from the website:
For a while I’ve been admiring Tony Hirst’s work visualising large networks like Twitter communities using the open source and cross-platform tool Gephi. Tony has lots of great posts for getting you started with Gephi including Visualising Twitter Friend Connections Using Gephi: An Example Using the @WiredUK Friends Network .
I’d been put off cooking something up myself until now because a) Tony has been doing a great job and I couldn’t see what I could add b) large network visualisations need large amounts of data (Tony has previously published his Twitter Community Grabbing Code – newt.py , but as I’m not whitelisted with the Twitter API I only get 350 hits/hr and not 20,000 which can be somewhat of a hindrance when getting follower relationships).
The advantage of NodeXL, particularly for graphing Twitter communities, is it has built-in features for grabbing the data for you. Not only that the coding is clever enough to handle the data collection for mere mortals, so when you hit your rate limit NodeXL waits until it should be able to get more data. NodeXL also has “built-in connections for getting networks from Flickr, YouTube, and your local email. Additional importers for Exchange Email Facebook , and Hyperlink networks  are available”.  
To let you see how to use NodeXL and to allow me to make comparisons with Gephi I thought I’d re-run Tony’s WiredUK example (besides why should I break my habit of only ever building on Tony’s work ;).
In Tony’s original post the beginning (getting the data) is at the end. Fortunately with NodeXL we can start here. I’m assuming you’ve downloaded and installed NodeXL so we begin by starting a new template – I do this from the Windows Start menu and selecting the NodeXL Excel Template shortcut from the Microsoft NodeXL application folder. From the NodeXL ribbon select Import > From Twitter Users’s Network. In the import dialog box enter:
  • Get the Twitter Network of the user with the username: wiredUK
  • Add a vertex for each: Person followed by the user
  • Levels to include: 1.5
  • and what level of authentication you want to use
NodeXL - get data from a user's network 
Once the data has been collected (you can see updates in the status bar of the import dialog box), when you click  ‘Show Graph’ you’ll get the raw form:
NodeXL - raw form 
At this point Tony highlights that:
Sometimes a graph may contain nodes that are not connected to any other nodes. (For example, protected Twitter accounts do not publish – and are not published in – friends or followers lists publicly via the Twitter API.) Some layout algorithms may push unconnected nodes far away from the rest of the graph, which can affect generation of presentation views of the network, so we need to filter out these unconnected nodes. The easiest way of doing this is to filter the graph using the Giant Component filter.
NodeXL has some ‘Dynamic Filters’ that include bounding the graph by x and y which could be used to crop the image, but I couldn’t find a component filter
NodeXL - Dynamic Filters 
Next Tony colours the graph using “the modularity statistic. This algorithm attempts to find clusters in the graph by identifying components that are highly interconnected.” NodeXL doesn’t have a built-in function for calculating ‘modularity’ but we can cluster nodes into groups using other algorithms, in this case Clauset-Newman-Moore. From the Groups menu make sure this algorithm is selected then click ‘Group by Cluster’
NodeXL - Group by Cluster 
When you Refresh Graph you’ll see the nodes have been colour coded as per group.
NodeXL - Cluster colour applied  
If you navigate to the Groups sheet there is a column where this colour is set (the right-click to set the colour doesn’t work for me but with the cell highlighted you can use the color picker within the Visual Properties part of the ribbon (top-right of the screenshot below)):
NodeXL - group colour 
In Tony’s example he says: “While we have the Statistics panel open, we can take the opportunity to run another measure: the HITS algorithm. This generates the well known Authority and Hub values which we can use to size nodes in the graph.” NodeXL doesn’t have a statistics panel as such but can calculate some but not as many metrics.
NodeXL - calculating metrics 
Next Tony looks at graph layout. In NodeXL there aren’t as many options but enough to get started with (I stuck with Fruchterman-Reingo). To add Twitter IDs and have a varying node size we Autofill the Visual Properties. As NodeXL doesn’t have a HITS algorithm I’m using Betweeness Centrality (for an explanation of this see Sheila MacNeill’s Betweenness Centrality – helping us understand our networks  post).
NodeXL - node size and labelling 
Within the Graph Options there are some further adjustments you can do like changing the joining lines to curves and adjusting the label font (unfortunately the font-size is fixed, it’s just the node icon that scales relative to the betweenness centraility.
NodeXL - graph options 
It’s still hard to see what is going on, but we have some more layout tricks. To start with we can layout graphs for groups in separate boxes and also adjust the strength of the repulsive force.
NodeXL - Layout options  
Once you’re happy if you right click on the graph there is an option to save it as an image.
NodeXL - save image 
And here is the final result
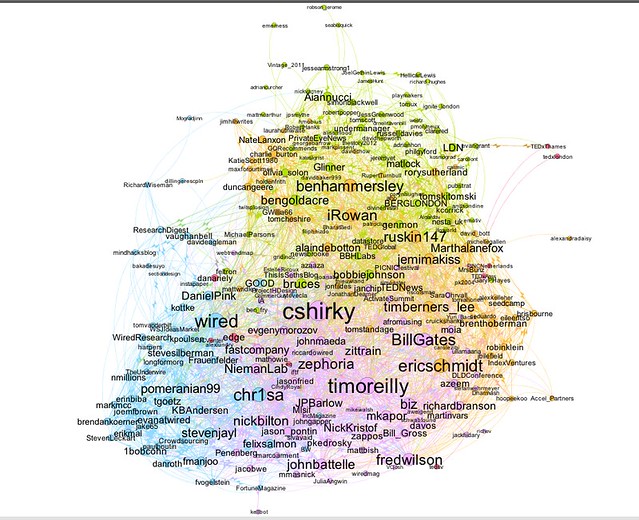
NodeXL - WiredUK 
and for comparison here’s what Tony produced
 
Which is better Gephi or NodeXL? For entry level (if such a thing exists given the number of different algorithms and theories in network analysis) NodeXL ticks a lot of the boxes. Its easy to grab data and do basic processing. If you want to do more you might want to switch to Gephi. The good news is NodeXL can export the data files in Gephi supported formats so potentially you can get the best of both worlds.


Difusión vía grupos conectados

Wireless Companies Could Use your Friends
Mobile carriers might get marketing insights from studying whom you call and what device you use.


Web connections: Social networks of iPhone users in late 2007 are shown in this diagram. It illustrates that many are socially connected to only a few fellow iPhone users


Each time you make a cell-phone call, your network provider knows whom you're calling, for how long, and what device you're using. Now researchers at one of the world's largest wireless carriers are exploring whether such information can help companies target their marketing pitches.
By analyzing billions of call records, the researchers at Telenor, a carrier in Scandinavia, mapped how social connections between people--measured partly by how often they called each other--correlated with the spread of Apple's iPhone after its 2007 debut. The research showed that socially connected groups of early adopters helped the iPhone spread rapidly. A person with just one iPhone-owning friend was three times more likely to own one themselves than a person whose friends had no iPhones. People with two friends who had iPhones were more than five times as likely to have sprung for the Apple device.


Now Telenor's team wants to translate insights like that into marketing campaigns. For instance, a company might send promotional text messages or ads to people whose friends already use a product--and who would presumably be more likely to buy the product as well.
"Marketing strategies based on this kind of analysis would be both useful and powerful compared to conventional ones," says Pal Sundsoy, one of the Telenor researchers. They collaborated with Rich Ling at the IT University of Copenhagen, Denmark, and will present their work at the International Conference on Advances in Social Networks Analysis and Mining next month.
They tracked the iPhone's spread using Telenor's database of CDRs--call detail records. A CDR is generated by every voice or text-message connection. Among other things, it contains the origin and destination number, the duration of a connection, and the unique mobile equipment identifier of the caller's handset. And rather than merely counting the growing number of iPhone users over time, the Telenor researchers performed what is known as social-network analysis. They examined the strength of the links between people by examining the number and duration of their calls and text messages.
Not only did they find that the spread of iPhones was greatly influenced by social circles, but also that this pattern differed from the way other devices and services rippled through the customer base. For instance, other Telenor products, including the Doro, a simple handset generally marketed at the elderly, did not exhibit the same kind of network effects. Neither did a video-calling feature introduced by Telenor in 2007. The video-calling service grew in popularity at first but suffered after a new pricing model was introduced.


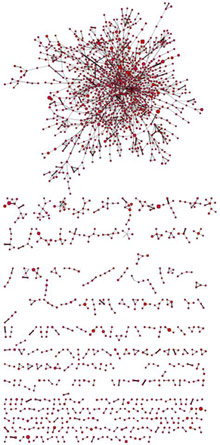
Model image: This diagram shows the evolution of the largest network of Telenor iPhone users over time. Each node represents one subscriber, and its color indicates the model used. In this case, red equals 2G, green means 3G, and yellow means 3GS.
Cell-phone networks have some of the best data for developing such ideas about how to target marketing campaigns, says Cristophe Van den Bulte, an associate professor of marketing at the Wharton School of the University of Pennsylvania who uses social-network analysis to study the diffusion of products.
"They have clean, relevant data because people don't make calls to just anyone," he explains. "Other network connections can be close to meaningless--for example, my relationships with my Facebook friends."


One possible avenue for further research would be to identify which people are most able to persuade their connections to adopt a new product, Van den Bulte says. He has tried to study such patterns in the way doctors choose medical products. Alternatively, instead of trying to find trendsetters, he says, "you may actually want to target people connected to others that are easy to influence. That's an approach that needs to be looked at more."
Privacy regulations could be an obstacle. The Telenor data had to be "anonymized," or stripped of identifying information, before the researchers could use it. Privacy law in Europe in particular could make it hard, Van den Bulte says, for wireless companies there to sell marketing insights based on social-network analysis to other companies.

MIT Technology Review


miércoles, 7 de noviembre de 2012

Gephi...

Análisis de Facebook usando Gephi (2/2)


Getting Started With Gephi Network Visualisation App – My Facebook Network, Part II: Basic Filters


In Getting Started With Gephi Network Visualisation App – My Facebook Network, Part I I described how to get up and running with the Gephi network visualisation tool using social graph data pulled out of my Facebook account. In this post, I’ll explore some of the tools that Gephi provides for exploring a network in a more structured way.
If you aren’t familiar with Gephi, and if you haven’t read Part I of this series, I suggest you do so now…
…done that…?
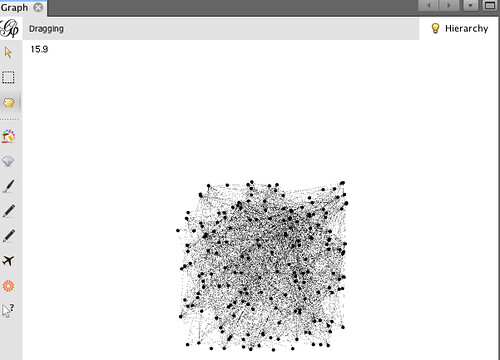
Okay, so where do we begin? As before, I’m going to start with a fresh worksheet, and load my Facebook network data, downloaded via the netvizz app, into Gephi, but as an undirected graph this time! So far, so exactly the same as last time. Just to give me some pointers over the graph, I’m going to set the node size to be proportional to the degree of each node (that is, the number of people each person is connected to).
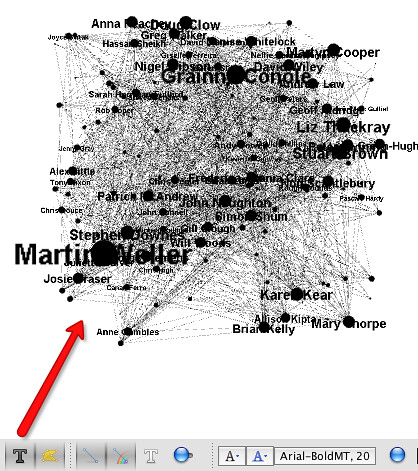
I can activate text labels for the nodes that are proportional to the node sizes from the toolbar along the bottom of the Graph panel:
…remembering to turn on the text labels, of course!
So – how can we explore the data visually using Gephi? One way is to use filters. The notion of filtering is incredibly powerful one, and one that I think is both often assumed and underestimated, so let’s just have a quick recap on what filtering is all about.
This maybe?
grean beans - House Of Sims (via flickr)
["green beans" by House Of Sims]
Filters – such as sieves, or colanders, but also like EQ settings and graphic, bass or treble equalisers on music players, colour filters on cameras and so on – are things that can be used to separate one thing from another based on their different properties. So for example, a colander can be used to separate green beans from the water it was boiled in, and a bass filter can be used to filter out the low frequency pounding of the bass on an audio music track. In Gephi, we can use filters to separate out parts of a network that have particular properties from other parts of the network.
The graph of Facebook friends that we’re looking at shows people I know as nodes; a line connecting two nodes (generally known as an edge) shows that that the two people represented by the corresponding nodes are also friends with each other. The size of the node depicts its degree, that is, the number of edges that are connected to it. We might interpret this as the popularity (or at least, the connectedness) of a particular person in my Facebook network, as determined by the number of my friends that they are also a friend of.
(In an undirected network like Facebook, where if A is a friend of B, B is also a friend of A, the edges are simple lines. In a directed network, such as the social graph provided by Twitter, the edges have a direction, and are typically represented by arrows. The arrow shows the direction of the relationship defined by the edge, so in Twitter an arrow going from A to B might represent that A is a follower of B; but if there is no second arrow going from B to A, then B is not following A.)
We’ve already used degree property of the nodes to scale the size of the nodes as depicted in the network graph window. But we can also use this property to filter the graph, and see just who the most (or least) connected members of my Facebook friends are. That is, we can see which people are friends of lots of the people am I friends of.
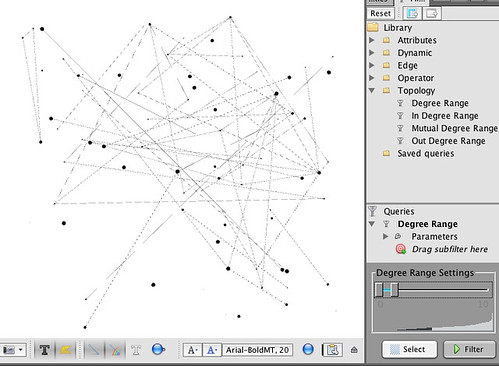
So for example – of my Facebook friends, which of them are friends of at least 35 people I am friends with? In the Filter panel, click on the Degree Range element in the Topology folder in the Filter panel Library and drag and drop it on to the Drag Filter Here
Adjust the Degree Range settings slider and hit the Filter button. The changes to allow us to see different views over the network corresponding to number of connections. So for example, in the view shown above, we can see members of my Facebook network who are friends with at least 30 other friends in my network. In my case, the best connected are work colleagues.
Going the other way, we can see who is not well connected:
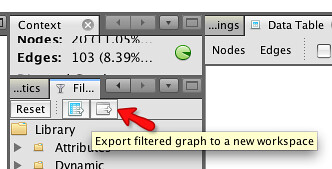
One of the nice things we can do with Gephi is use the filters to create new graphs to work with, using the notion of workspaces.
If I export the graph of people in my network with more than 35 connections, it is place into a nw workspace, where I can work on it separately from the complete graph.
Navigating between workspaces is achieved via a controller in the status bar at the bottom right of the Gephi environment:
The new workspace contains just the nodes that had 35 or more connections in the original graph. (I’m not sure if we can rename, or add description information, to the workspace? If you know how to do this, please add a comment to the post saying how:-)
If we go back to the original graph, we can now delete the filter (right click, delete) and see the whole network again.
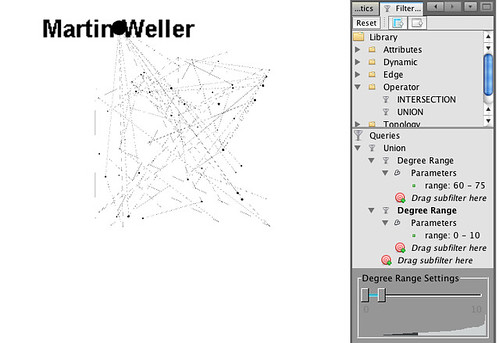
One very powerful filter rule that it’s worth getting to grips with is the Union filter. This allows you to view nodes (and the connections between them) of different filtered views of the graph that might otherwise be disjoint. So for example, if I want to look at members of my network with ten or less connections, but also see how they connect to each other to Martin Weller, who has over 60 connections, the Union filter is the way to do it:
That is, the Union filter will display all nodes, and the connections between them, that either have 10 or less connections, or 60 or more connections.
As before, I can save just the members of this subnetwork to a new workspace, and save the whole project from the File menu in the normal way.
Okay, that’s enough for now… have a play with some of the other filter options, and paste a comment back here about any that look like they might be interesting. For example, can you find a way of displaying just the people who are connected to Martin Weller?

Análisis de Facebook usando Gephi (1/2)

Getting Started With The Gephi Network Visualisation App – My Facebook Network, Part I


A couple of weeks ago, I came across Gephi, a desktop application for visualising networks.

And quite by chance, a day or two after I was asked about any tools I knew of that could visualise and help analyse social network activity around an OU course… which I take as a reasonable justification for exploring exactly what Gephi can do :-)
So, after a few false starts, here’s what I’ve learned so far…
First up, we need to get some graph data – netvizz – facebook to gephi suggests that the netvizz facebook appcan be used to grab a copy of your Facebook network in a format that Gephi understands, so I installed the app, downloaded my network file, and then uninstalled the app… (can’t be too careful ;-)
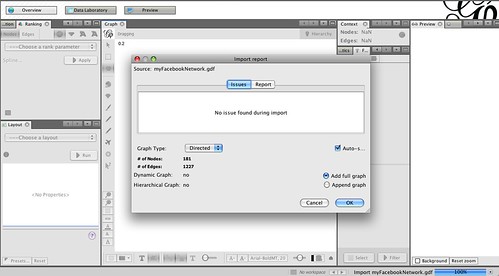
Once Gephi is launched (and updated, if it’s a new download – you’ll see an updates prompt in the status bar along the bottom of the Gephi window, right hand side) Open… the network file you downloaded.
NB I think the graph should probably be loaded as an undirected graph… That is, if A connects to B, B connects to A. But I’m committed to the directed version in this case, so we’ll stick with it… (The directed version would make sense for a Twitter network (which has an asymmetric friending model), where A may follow B, but B might choose not to follow A. In Facebook, friending is symmetric – A can only friend B if B friends A.
(Btw, I’ve come across a few gotchas using Gephi so far, including losing the window layout shown above. Playing with the Reset Windows from the Windows menu sometimes helps… There may be an easier way, but I haven’t found it yet…)
The graph window gives a preview of the network – in this case, the nodes are people and the edges show that one person is following another. (Remember, I should have loaded this as an undirected graph. The directed edges are just an artefact of the way the edge list that states who is connected to whom was generated by netvizz.)
Using the scroll wheel on a mouse (or two finger push on my Mac mousepad), you can zoom in and out of the network in the graph view. You can also move nodes around, view the labels, switch the edges on and off off, and recenter the view.

Not shown – but possible – is deleting nodes from the graph, as well as editing their properties.
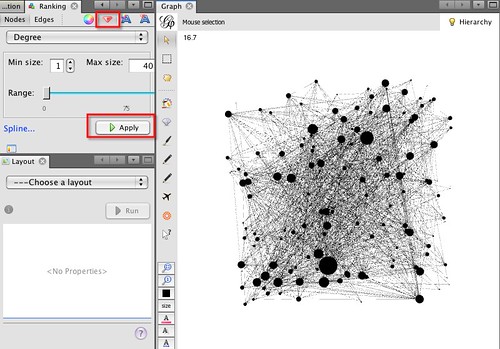
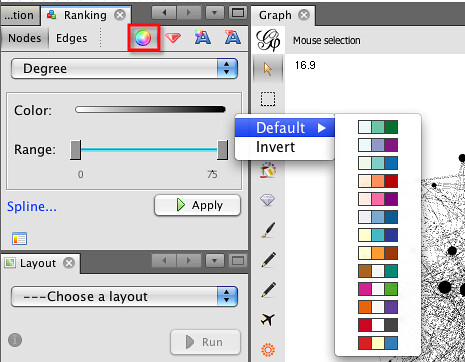
You can also generate views of the graph that show information about the network. In the Ranking panel, if you select the Nodes tab, set the option to Degree (the number of edges/connections attached to a node) and then choose the node size button (the jewel), you can set the size of the node to be proportional to the number of connections. Tune the min and max sizes as required, then hit apply:
You can also colour the nodes according to properties:
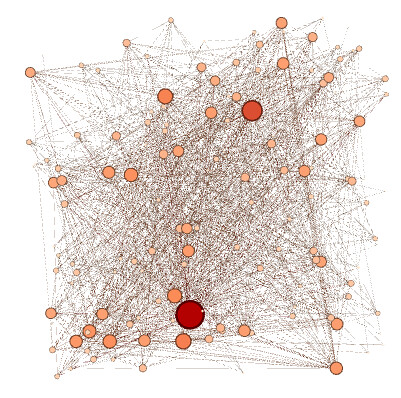
So for example, we might get something like this:
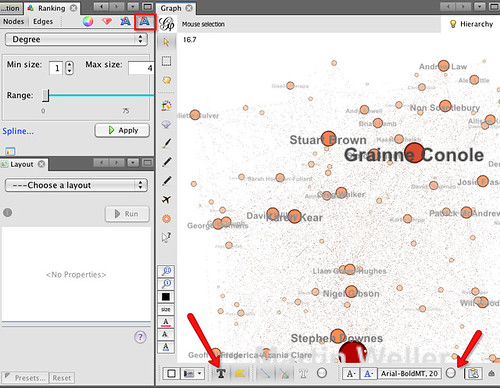
Label size and colour can also be proportional to node attributes:
To view the labels, make sure you click on the Text labels option at the bottom of the graph panel. You may also need to tweak the label size slider that’s also on the bottom of the panel.
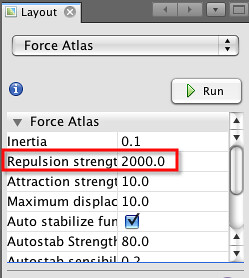
If you want to generate a pretty version of the graph, you need to do a couple of things. Firstly, in the layout panel, select a layout algorithm. Force Atlas is the one that the original tutorial recommends. The repulsion strength determines how dispersed the final graph will be (i.e. it sets the “repulsive force” between nodes); I set a value of 2000, but feel free to play:
When you hit Run, the button label will change to Stop and the graph should start to move and reorganise itself. Hit Stop when the graph looks a little better laid out. Remember, you can also move nodes around in the graph as show in the video above.
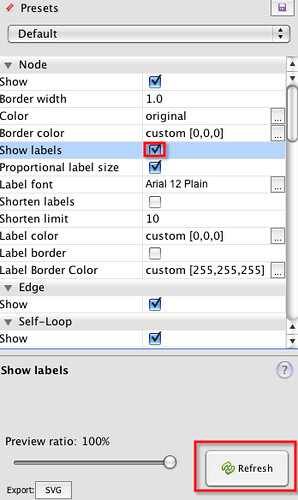
Having run the Layout routine, we can now generate a pretty view of the graph. In the Preview Settings panel on the left-hand side of the Gephi environment, select “Show Labels” and then hit “Refresh”:
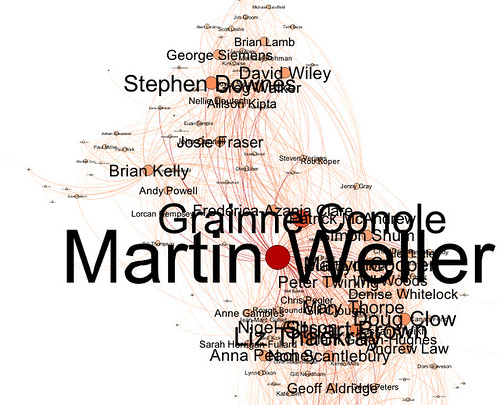
In the Preview panel, (next tab along from Preview Settings), you should see a the prettified, 3D layout view:
Note that in this case I haven’t made much attempt at generating a nice layout, for example by moving nodes around in the graph window to better position them, but you can do… (just remember to Refresh the Preview view in the Preview Settings… (There must be a shortcut way of doing that, but I haven’t found it…!:-(
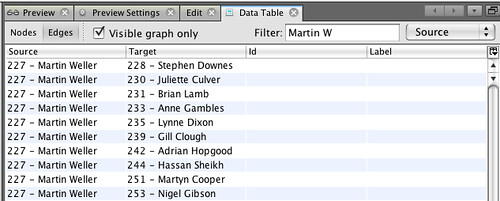
If you want to look at who any particular individual is connected to, you can go to the
Data Table panel (again in the set of panels on the right hand side, just along from the Preview tab panel) and search for people by name. Here, I’m searching the edges to see who of my Facebook friends a certain Martin W is also connected to on Facebook;
It’s easy enough to highlight/select and copy these cells and then post them into a spreadsheet if required.
So that’s step 1 of getting started with Gephi… a way of using it to explore a graph in very general terms; but that’s not where the real fun lies. That starts when you start processing the graph by running statistics and filters over it. But for that, you’ll have to wait for the next post in this series… which is here: Getting Started With Gephi Network Visualisation App – My Facebook Network, Part II: Basic Filters

Ouseful.info