lunes, 15 de julio de 2013

8 herramientos analíticas de Twitter

8 Excellent Twitter Analytics Tools to Extract Insights from Twitter Streams

Yung Hui Lim


Twitter is now the third most popular social network, behind Facebook and MySpace (Compete, 2009). A year ago, it has over a million users and 200,000 active monthly users sending over 3 million updates per day (TechCrunch, 2008). Those figures have almost certainly increased since then. With the torrential streams of Twitter updates (or tweets), there's an emerging demand to sieve signals from noises and harvest useful information.
Enter Twitter Analytics, Twitter Analysis, or simply just Analytwits (in the tradition of Twitter slang). These analytics tools are growing in numbers; even Twitter is developing them.
Besides Twitter Search, the following 8 Analytwits are some of the more useful web applications to analyze Twitter streams. Each of these tools serve specific purpose. They crawl and sift through Twitter streams; also, aggregate, rank and slice-and-dice data to deliver some insights on Twitter activities and trends. There's no single best analytic tool available but use in combination, they can extract interesting insights from Twitter streams.
8 Great Tools for Social (Twit)telligence

twitalyzerTWITALYZER provides activities analysis of any Twitter user, based on social media success yardsticks. Its metrics include (a) Influence score, which is basically your popularity score on Twitter (b) signal-to-noise ratio (c) one's propensity to ‘retweet' or pass along others' tweets (d) velocity - the rate one's updates on Twitter and (e) clout - based on how many times one is cited in tweets. Its Time-based Analysis of Twitter Usage produces graphical representation of progression on various measures. Using Twitalyzer is a easy; just enter your Twitter ID and that's it! It doesn't require any password to use its service. Speed of analysis is depending on the size of your Followed and Followers lists.

microplazaMICROPLAZA offers an interesting way to make sense of your Twitter streams. Called itself “your personal micro-news agency,” it aggregates and organizes links shared by those you follow on Twitter and display them as newstream. Status updates that contain similar web links are aggregated into 'tiles.' Within a tile, you can see updates from those you follow and also those you don't. Another interesting feature is ‘Being Someone', which you can peek into someone's world and see their 'tiles'; designed to facilitate information discovery. You can also organize those you follow into groups or ‘tribes'. You can create, for example, a knitting ‘tribe' to easily what URLs your knitting friends are tweeting. In addition, you can bookmark 'tiles' for future reference. Its yet-to-be-released feature, Mosaic, allows users to group together the bookmarked 'tiles' and turn them into social objects - for sharing and discussion. At the time of this posting, MicroPlaza is still in private beta.

twistTWIST offers trends of keywords or product name, based what Twitter users are tweeting about. You can see frequency of a keyword or product name being mentioned over a period a week or a month and display them on a graph. Select an area on the graph to zoom into trend for specific time range. Click on any point on the graph to see all tweets posted during a specific time. One can also see the latest tweets on the topic. Twist also allows you do a trend comparison of two (or more) keywords. Its graphs are embeddable on any website. A simple but effective tool for trending, similar to what Google Trends is doing for search queries.

TwitturlyTWITTURLY tracks popular URLs tracker on Twitter. With Digg-style interface, it displays 100 most popular URLs shared on Twitter over the last 24 hours. On Digg, people vote for a particular web content, whereas on Twitterurly, each time a user share a link, it is counted as 1 vote. This is a good tool to see what people are ‘talking' about in Twitterville and see total tweets that carry the links. Its URL stats provides information on number of tweets in last 24 hrs, last 1 week and last 1 month. It also calculates total estimated reach of the tweets. Another interesting site is Tweetmeme, which can filter popular URLs into blogs, images, videos and audios.

TweetStatsTWEETSTATS is useful to reveal tweeting behavior of any Twitter users. It consolidates and collates Twitter activity data and present them in colorful graphs. Its Tweet Timeline is probably the most interesting, as it shows month-by-month total tweets since your joined Twitter (TweetStats showed Evan Williams, co-founder of Twitter, started tweeting since March 2006; 80 tweets during that month). Twitterholic can also show when a person joined Twitter but not in graphical format. Other metrics include (a) Aggregate Daily Tweets - total tweets, by day (c) Aggregate Hourly Tweets - total tweets, by hour (d) Tweet Density: hourly Twitter activities over 7 days period (e) Replies to: top 10 persons you've replied and (f) Interfaces Used: top 10 clients used to access Twitter. In addition, its Tweet Cloud allows you to see the popular words you used in your tweets.

TwitterFriendsTWITTERFRIENDS focuses on conversation and information aspects of Twitter users' behaviors. Two key metrics are Conversational Quotient (CQ) and Links Quotient (LQ). CQ measures how many tweets were replied whereas LQ measures how many tweets contained links. Its TwitGraph displays six metrics - Twitter rank, CQ, LQ, Retweet Quotient, Follow cost, Fans and @replies. Its interactive graph (using Google Visualization API) can displays relationships between two variables. In addition, you can search for conversations between two Twitter users. This app seems to slice-and-dice data in more ways compared to other applications listed here.

ThummitTHUMMIT QUICKRATE offers sentiments analysis, based on conversations on Twitter. This web application identifies latest buzzwords, actors, movies, brands, products, etc. (called ‘topics') and combines them with conversations from Twitter. It does sentiment analysis to determine whether each Twitter update is Thumms up(positive), neutral or Thumms down (negative). Click on any topic to display opinions on the topic found on Twitter. In addition, it allows people to vote on topics via its website or mobile phones. The idea behind this app is good but still has some kinks to work out.

TweetEffectTWEETEFFECT matches your tweets timeline with your gain/lose followers timeline to determine which tweet makes you lost or gain followers. It analyze the latest 200 tweets and highlights tweets that coincides with you losing or gaining two (or more) followers in less than 5 minutes. This application simplistically assumed that your tweet is the sole factor affecting your gain/lose followers pattern. But, in reality, there are many other factors involved. Nevertheless, TweetEffect is still a fun tool to use; just don't take the results too seriously.

Let's Continue the Discourse on Twitter
Which of the abovementioned Twitter analytics you like the most? How can these tools generate revenue? Have you discovered any other interesting Twitter analytics? Share your thoughts on Twitter; find me @limyh

viernes, 12 de julio de 2013

Factor de impacto en los journales: ¿Para que sirven?

Journal impact factors: what are they good for?


The ISI journal impact factors for 2012 were released last month. Apparently 66 journals were banned from the list for trying to manipulate (through self-citations and “citation stacking”) their impact factors.

There’s a heated debate going on about impact factors: their meaning, use and mis-use, etc.  Science has an editorial discussing impact factor distortions.  One academic association, the American Society for Cell Biology, has put together a declaration (with 8500+ signers so far)–San Francisco Declaration on Research Assessment (DORA)–highlighting the problems caused by the abuse of journal impact factors and related measures. Problems with impact factors have in turn led to alternative metrics, for example see altmetrics.
I don’t really have problems with impact factors, per se.  They are one, among many, measures that might be used to measure journal quality.  Yes, I think some journals indeed  are better than others.  But using impact factors to somehow assess individual researchers can quickly lead to problems.  And, it is important to recognize that impact factors assume that articles within the journal are homogeneous, though within-journal citations of course are radically skewed.  Thus a few highly-cited pieces essentially prop up the vast majority of articles in any given journal. Citations might be a better measure, though also highly imperfect.  If you want to assess research quality: read the article itself.
On the whole, article effects trump journal effects (as Joel Baum’s article also points out, see here).  After all, we all have one-two+ favorite articles, published in some obscure journal no one has ever heard of.  Just do interesting work and send it to journals that you read.  OK, that’s a bit glib.  I know that all kinds of big issues hang in the balance when trying to assess and categorize research: tenure and promotion, resource flows, etc. Assessment and categorization is inevitable.
A focus on impact factors and related metrics can quickly lead to tiresome discussions about which journal is best, is that one better than this, what are the “A” journals, etc.  Boring.  I presented at a few universities in the UK a few years ago (the UK had just gone through its Research Assessment Exercise), and it seemed that many of my interactions with young scholars devolved into discussing which journal is an “A” versus “A-” versus “B.”  Our lunch conversations weren’t about ideas – it was disappointing, though also quite understandable since young scholars of course want to succeed in their careers.
Hopefully enlightened departments and schools will avoid the above traps and focus on the research itself.  I think the problems of impact factors are well-known by now and hopefully these types of metrics are used sparingly in any form of evaluation, and only as one imprecise datapoint among many others.
[Thanks for Joel Baum (U of Toronto) for sending me some of the above links.]

martes, 9 de julio de 2013

El Facebook del Senado estadounidense

The Senate as Facebook


Ever wonder what the Senate would look like viewed through the lens of Facebook?  Us too.


This is Facebook.
Now, thanks to Yahoo’s Chris Wilson, we know. Using Senate votes, Wilson has created a mini-social network of the world’s greatest deliberative body.
“For every member, I calculated which other senators voted the same way at least 75 percent of the time. In effect, this organizes the Senate as a mini-Facebook of 100 users, in which any given pair of senators are friends if they meet this 75-percent threshold….Visualizations like this one work by treating the senators as particles that repel one another, and treating the connections between them as springs that hold them together. Because the Democrats vote so cohesively, with few defectors, they are held together by a large number of springs.”
In the chart below, you can see the Senate as a whole or sort via specific Senator to see whether they have any ties — meaning they vote with a colleague 75 percent or more of the time — to other Senators.
What’s clear from the chart is that while Senate Democrats are more closely aligned than Republicans in their voting patterns so far in 2013 — Wilson notes that 22 Democrats have voted exactly the same on every vote this year — there are very few ties between the two parties. The two members sitting in the middle are Republicans Sens. Lisa Murkowski (Alaska) and Susan Collins (Me.), two of the noted moderates in the chamber.
Then there is the strange case of Louisiana Sen. David Vitter (R) and New Jersey Sen. Frank Lautenberg (D). Neither man has voted with any other senator more than 75 percent of the time during 2013. (Lautenberg, who is retiring in 2014, hasn’t even voted with any other Senator 65 percent of the time.)
The most obvious storyline from the amazing tool Wilson has built is that the two parties in the Senate have, at least by their voting records in 2013, almost nothing in common. That affirms the widening partisan divide that we’ve observed in the Senate and in politics more broadly over the past few years.
Fiddle around with Wilson’s infographic. It’s a great tool that can spawn a thousand insights into how the Senate works (and doesn’t). What’s yours?
The Fix

domingo, 7 de julio de 2013

Multitudes generadas por robots en el ciberespacio

The Wisdom of Cyborg Crowds: A Talk by Tim Hwang

By natematias5 days ago - permalink
Can we augment and enhance crowd behaviour using automated systems?

Hi! I’m Nathan, a summer intern at FUSE from the MIT Media Lab where I’m a PhD student. When we’re not posting adorable Blinks and supercut video parties to So.cl, FUSE is also a research group that asks questions about the future of social experience online.  


Two weeks ago, we received a visit from Tim Hwang, who gave a talk on the role that bots may come to play in social networks.  Here’s what he shared with us (you can watch the video here).
Tim Hwang (timhwang.com) is a remarkably prolific creator of things on the Internet. When Tim started the joke company Robot Robot & Hwang, he wasn’t a lawyer. Now Tim joins us after completing an actual law degree. He spent several years as a researcher at the Berkman Center for Internet and Society looking at new ways to foster collaboration online. Tim was previously a founding collaborator of ROFLCon and The Awesome Foundation for the Arts and Sciences. He came to speak with us specifically about the Pacific Social Architecting Corporation.
image
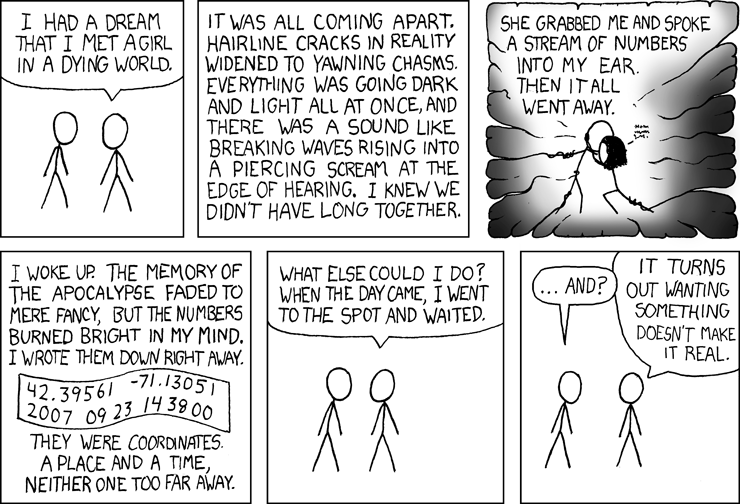
Tim was first inspired to think about online crowds the day he went to a location listed in an XKCD cartoon. Many other people went too, leading to an all day party.
Tim and other friends went on to create ROFLCon in 2008, gathering people who were famous on the Internet to talk about internet things.  When people likeDouble Rainbow GuyTron Guy, and Scumbag Steve agreed to speak, the conference was able to attract over 2,000 attendees.
ROFLCon speakers included recently-famous memes and people who have been involved in the history of the Internet — designing things like comic sans, newsgroups, and BBSes. Topics included Internet culture, Internet fame, trolling, and the possibilities of the Internet for creating change (for more, read When Funny Goes Viral, by Rob Walker).
A History of the Crowd
What *is* the crowd, and what should we think of it? Tim shared an overview of popular ideas about online crowds, alongside the critiques of crowd-skeptics:
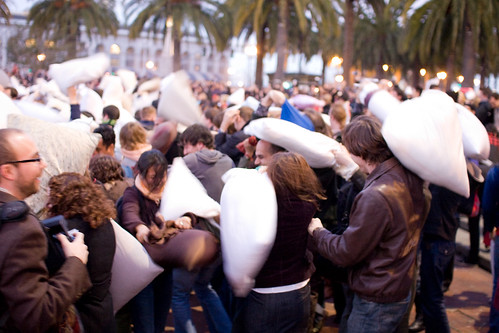
Pillow Fight San Francisco 2008
San Francisco Pillow Fight (Flash Mob) 2008, image by Scott Beale
In the Wisdom of Crowds, James Surowiecki wondered if many eyes might be able to use the Internet to find things, make predictions, and create content. The counter-argument to this can be summarised in the work of Eli Pariser, who pointed out in the Filter Bubble that communities can often become narrow in their outlook and become echo chambers.
Are crowds wise? During Reddit’s recent attempt to identify the Boston bomber, Reddit found people, but they found the wrong people.
Clay Shirky advanced the cognitive surplus idea in Here Comes Everybody. He argued that the Internet allows us to use our time for creative pursuits: Wikipedia, films, and other creative media. In contrast, Jaron Lanier, in You are Not A Gadget, argues that people tend to use the Internet for incremental creativity rather than unique creations.
To illustrate incremental creativity, Hwang shows us an example of the Scumbag Steve meme— many memes are just a single template that’s iterated infinitely (Here at FUSE, our researcher Andres Monroy-Hernandez recently published a paper examining the trade-off between originality and generativity).
Regardless of whether crowds can solve discrete problems or foster creativity, can the Internet be used to mobilise people for civic purposes? People like Tim O’Reilly and the writers of MacroWikinomics forward this view. On the skeptic side, Evgeny Morozov points out that established institutions have many tools to suppress online activity. Another skeptic, Ethan Zuckerman, points out that regardless of any communications online, cultural barriers may get in the way of civic uses of technology.
image
Marriage Equality Facebook Memes, collected by Elena Agapie
Are crowds actually good at solving problems? Can they be used for creativity? Might they be good at mobilising people for on the ground tasks? Hwang outlines three basic problems for directing crowds in that way:
  • improper convergence — maybe you find the wrong person
  • incremental innovation — maybe what crowds do isn’t significant
  • ineffectual offline — maybe it’s not possible to coordinate effective offline participation
Crowds also hate to be managed. In 2006, Chevy asked the crowd to create ads for them, and many of them parodied the company. Crowds sometimes make terrible choices. Hwang points us to Mackay’s history of Extraordinary Popular Delusions and the Madness of Crowds as a great example.
Social Bots
Larger social networking companies offer what Hwang calls “social neutrality" — offering social infrastructure but not offering any intentional influence of people’s social relations. Hwang suggests that people who control networks could carry out social architecture, influencing the structure of social relations with technology. That’s what he and his collaborators have tried to do with social bots.
Social bots are not a new phenomenon. Hwang tells the story of a book by Peter Lawrence, The Making of a Fly, which suddenly reached a $23.6 million price on Amazon one day. It turns out that two book companies were using bots to set book prices, and the bots became locked in a cycle of escalation with each other. Another example of bots in the book trade are titles allegedly authored by Lambert M Surhone, but actually created by bots. In another example, a trading bot was trading Berkshire Hathaway shares in response to news about Anne Hathaway.
Once we understand how bots interact with people, might we be able to control the interactions of bots with society? Hwang tells us about A Tool to Deceive and Slaughter, a black box that keeps on posting itself on Ebay, moving from person to person and increasing its price. “Digitisation enables botification," he tells us: any interaction that’s digital can be turned into a bot or used by one.
The Pacific Social Architecting Experiment
This discussion of the crowd and our interaction with bots is the context in which Tim and his colleagues created the Pacific Social Architecting Experiment (pdf). Could bots create interaction with humans on Twitter, they wondered?
The community for this experiment was a set of 500 sample users on Twitter who liked talking about cats. Three teams took on the challenge to create bots to provoke a response from those users, and bots were scored by the kind of interaction that resulted. One team’s bot used generic questions and answers, asking basic questions and using phrases like “that’s great" or “True dat." The second team used Mechanical Turk— bots hired humans to answer questions for them. In this case, humans were actually creating the text to be shared by bots. The third group, in Boston, based their bot on Realboy, a project by Zack Cobum and Greg Marra. Realboy is a bot that imitates the behaviour of other users on Twitter.
Some energy also went into attacking other bots run by the other teams. The third team also created “botcop," a bot that targeted the other team’s bots by calling out the other team’s bots.
In his slides, Tim shows us changes to the topology of the social networks that resulted from this experiment— arguing that the actions of the bots was associated with changes in the relationships of the people who interacted with them.
If we could reliably shape social behavior with these bots, Tim asks, would it be possible to deploy them in a variety of social environments? Pacific Social has started to test “connector bots." Perhaps these bots could identify disconnected parts of networks and use those bots to knit together those networks? Connector bots might become valuable social prostheses, Tim tells us. Not every friend group has someone who’s the life of the party and who introduces people to people socially.
Cyborg Crowds as Social Prostheses
Can bots be used to address the limitations of the the crowd that Tim identified at the beginning of his talk?
1. Improper convergence. Might cyborg crowds be used to challenge groupthink? One approach would be to create “skeptobots." Ordinarily, those bots would behave like humans in the network. Perhaps when there’s a big news event, the bots could start saying lots of skeptical things to spread skepticism. The bots could also amplify more naturally skeptical people. When the events aren’t happening, the bots could test people by tweeting material that’s not credible and observe which people respond by fact-checking them. They could then amplify those people during a crisis.
2. incremental innovation. If creativity online isn’t diverse enough, could bots inject diversity into the conversation? Paired are a possible strategy to create pipes between communities that don’t exist. A bot in community A could ask questions of people in that community. A second bot could share their responses to community B.
3. ineffectuality online. How can we give bots the ability to reach out into the real world? Bots could hire people on TaskRabbit to do their bidding in the real world. Tim tells us the idea of “the bot birthday." After a bot cultivates enough friends online, perhaps the bot could hire people to put on a party, invite their friends, and then just before the party, says “whoops, I got stuck in traffic."
image
(horseEcomics is a webcomic whose text is written by a Twitter bot)
Future Questions for Social Bots
One issue for social bots is ethics. During the Pacific Social experiment, someone became infatuated with one of the bots, and they weren’t sure what to do. New bots have a social fail-safe, which slows it down or shuts it down if conversation with someone becomes too intense.
Social bots need design principles, a set of questions and experiments that build up our knowledge of what they’re capable of.
Finally, Tim hopes for a an understanding of the larger structures that can be created with social bots— to ask if it’s possible to outline a desired social structure and put bots to work to create it.
Questions
An audience member asks: The examples focused on creating connections between people. Have any of the bots focused on cutting off relationships? Tim answers that the black hat implications are already there and being used. Twitter bots attacked and supported candidates in last year’s Mexican presidential election. PacSocial doesn’t do any of that for ethical reasons. In the future, Tim can imagine people who work to destroy networks and people who try to defend them.
At what point is a bot no longer a bot, Andres asks? Tim responds that whether it’s human or not doesn’t matter. What matters is that they can create a script that creates a predictable change in the network.
If the bots go away, does the network shift back, Emma Spiro asks? Maybe social norms produce that set of connections? Tim responds that in their experiments, bots need to continue tweeting maintain the new networks created by their presence.
Emma follows up: to what degree are bots influencing the conclusions of social scientists? Tim responds that spam is a huge problem and has to be taken into account when you do research on social science. At what point does social data become dishonest, asks Tim? It’s hard to say.
What actually happens to people who talk to bots, someone asks. Do bots actually change people and their relationships? PacSocial has looked at followup data. In some cases, groups connected by bots have stayed linked. In others, those links disappeared.
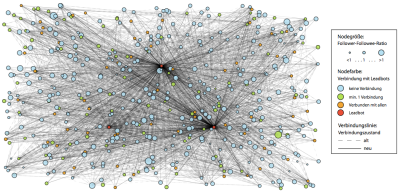
image(image from a study by Claudia Wagner measuring the impact of SocialBots)
I asked Tim if we can actually measure the impact of bots. I pointed to research by Silva Mitter, Claudia Wagner, and Markus Strohmaier that questioned the claims of the original PacSocial report (pdf)(slides here). Tim responds that yes, in that particular case, the influence of the bots was less than they had initially claimed. Also, social bot experiments are problematic in the way that all experiments in online social networks are.
More access to data would make it easier to answer questions about the impact of bots— that’s becoming hard, as companies like Twitter are limiting access by researchers. It’s also important to connect this work with research in universities. It’s not easy to conduct this kind of research within a university because the IRB rules sometimes don’t allow it. That ends up hindering people from building things that Tim thinks could be very good. Finally, to measure the offline influence of change on social networks, it’s important to have access to data about what happens offline— data that is often hard to get.

sábado, 6 de julio de 2013

El prisma de conversación no necesariamente genera influencia

Why The Conversation Prism Misses the Boat on Influence

Danny Brown


Recently, Altimeter analyst Brian Solis released the fourth iteration of the Conversation Prism, a visual representation of where the social web stands today.
As part of this update the prism included influence, in a nod to how key this area of social media has become for today’s businesses, in both goals and tactics. Unfortunately, like many other examples, the influence part of the prism misses an opportunity to move beyond the obvious and really discuss where influence is going.
By primarily highlighting social scoring platforms like Klout and Kred, the prism talks less about influence and more about amplification, popularity and ego-centric versus customer-centric platforms (thanks for that last phrase, Chris Heuer!).
For me, this misses the much bigger influence picture, so I reached out to Brian on the original LinkedIn post, and discussed the inclusion of scoring and the exclusion of better solutions.

On Moving the Influence Conversation Forward (Or Not)

DB: What stands out is the Influence line. Same old platforms, either based around scores or single networks. Where’s the innovation? Where are the new leaders that are really pushing the influence discussion forward? Companies like TraackrAppinionsInNetwork Inc.,TellagenceMeasurely, etc? With their exclusion and your focus on the technologies that are questionable when it comes to measuring influence, it dilutes this data and leaves it looking a bit outdated even as it’s just published.
BS: Those companies are indeed leaders in the field. In fact, I’ve written about Digital Influence going back to the late 90s. However, their place is not on this version of the prism as the majority of them are services rather than networks. So, it’s more focused and therefore allows it to be iterative in a systematic fashion.
DB: Klout isn’t a network. Kred isn’t a network. PeerIndex isn’t a network. There is no networking to be had on these sites. Indeed, PeerIndex’s own chief data scientist sees them as the type of company that provides data and consultancy services to their clients. Even taking that aside, though, these companies aren’t really measuring influence – they need you to add your other networks for them to successfully “measure” you.
By that definition, they’re saying you’re only influential based on your public Twitter presence (since that’s all they effectively measure without your strict permissions and connecting of other accounts). It’s why their inclusion on a line of “influence” is skewing the data and reducing any validation of the prism itself.
If you want to highlight true influence, look at how Tellagence tracks the ebbs and flows of influential communities and how that changes; or Traackr’s INA solution of who influences the influencers; or Appinions and their use of offline data and reactions to flesh out online influence; or Measurely and their parent company, Lymbix, and how they can successfully identify the emotion an update or content instills in you, making it easier to identify what type of media, content, etc., to use when looking to attract that audience. *That’s* influence – scoring isn’t.
Tellagence Discover Visualization
BS: I tend to disagree…they are networks. And, if you read my report, you will see how I trash the “idea” of scores. Might help to read first. Saves time when you see we are in agreement.
DB: I read that report when it came out, and questioned it at time of publication. It proposes that scoring platforms track more than they do; they don’t. The majority of information they use is from the Twitter firehose, regardless of what they would have you believe (why do you think Kred is so worried about the legal case with Twitter?).
But you have to be consistent as well; in one breath, you say they’re influence platforms (your prism) and then in the other you say they don’t measure influence, but the potential (something we do agree on, though probably not to the same level). And I stand by the definition they are not networks – unless you call a +K a true interaction along the lines of a Twitter interaction or a G+ conversation. They are data repositories – nothing more, nothing less.
BS: No…no the report doesn’t draw that conclusion at all…in fact, it’s quite the opposite. And in terms of consistency…I’ve 10 years of research, development and experimentation in digital influence. My published work speaks for itself. In regards to an infographic that has “influence” as a category and not as a validation of the social networks that purport influence as a standard, that’s between you and those developers…
I merely created a sliver because the traction of some of those networks has the notable attention and budget of some of the biggest brands in the world. The center of the graphic is there for a reason. So, you can either try to pick a debate that at its root is out of context or you can focus your time on teaching other people about the merits of the services that help brands do a better job i.e. Traackr, eCairn, and the like.
And don’t forget, I co-founded and sold Buzzgain, which was an early player in this arena. If you step back from a ping pong game in the comments, you’ll probably find that I support your message and mission.
At this point I decided to not reengage as the conversation seemed to turn from a discussion about influence into a promo for accomplishments over questions about the inclusion of certain platforms when others would appear more suited to be there.
However, there were some valid points made, and some less valid ones, that deserve addressing, so let’s dig in some more here.

The Idea of Influence Platforms as Networks

Solis’s main reasoning for the inclusion of Klout, Kred, etc., versus more relevant platforms when it comes to actual influence, is that the former are networks while the latter are more service-led.
Yet within these platforms, there is absolutely zero networking opportunities or functions by today’s definition of a social network (unless the awarding of Kred or Klout points via a simple button click is classed as networking). Additionally, if they are networks, then shouldn’t they have been placed in the Network area of the prism?
However, moving beyond that simple overview, even the platforms included see themselves as services. Kred’s business model is to provide the data they gather to their clients, and act as a consultancy on how best to use them.
Kred for Brands
The closest influence platforms – public scoring or otherwise – come to “networking” is within the InNetwork model, where brands and influencers can connect directly within the portal and agree on project deliverables, compensation, etc. Even that, though, is limited to two parties, which makes it a more gated community/network versus a truly public one.

The Potential for Influence versus Actual Influence

In the report that Solis refers to, he speaks of social scoring platforms offering the “potential for influence” and this is where we definitely agree.
During research for our book, Sam Fiorella interviewed PeerIndex founder Azeem Azhar, who shared this interesting and definitive statement on where social scoring stands in the influence sphere:
There’s no real way for companies today, at a large scale, to identify who are the nodes that are more likely to spread messages around given categories. If you’re looking for the 7 people most important to me right now, PeerIndex isn’t for you. If you’re looking for the top 70,000, look to us. That’s where PeerIndex is and where we’re going.
There are two key parts to Azhar’s quote: influence can’t be built at generic scale, which is what scoring platforms profess to offer, and real influence comes from much smaller communities and interaction.
It’s why the platforms I suggested should be in the influence sector of the prism make much more sense than the current scoring-led inclusions – they’re measuring real influence and what that means for a business, versus those that may or may not be influential and lack relevance because of that.

The Social Bubble Needs Popping

I’ll freely admit I’m more than a bit biased when it comes to discussing influence and where it stands today, as far as the social web is concerned.
For the last three to four years, I’ve been a vocal critic of the data and identification methods that scoring platforms use when it comes to determining influence. They’re built for generic metrics, that agencies and brands can use to start the real legwork.
Indeed, in a recent survey of more than 1,300 marketers, brands and agenciescommissioned by ArCompany and Sensei Marketing, 94% said “they didn’t fully trust the metrics provide by scoring platforms”, with 55% stating that “scoring platforms were ineffective at identifying influencers.”
influence marketing survey
These are the very companies, brands and professionals that the Conversation Prism is geared towards, and highlights why the continued inclusion of scoring platforms is in danger of diluting the authority of the prism itself.
If we’re to truly move beyond the social media bubble that seems to regurgitate the same names and platforms year in, year out, we need to offer real answers and solutions versus those that have bigger awareness but less relevance.
Once we do that, everyone benefits, because only the best and most relevant information is being offered. And isn’t that where we all aim to be anyway?
image: ConversationPrism.com

jueves, 4 de julio de 2013

Acción colectiva: El Twitter marca el paso de las protestas en Brasil

How is the Brazilian Uprising Using Twitter?

By andresmh2 days ago - permalink
More than a million Brazilians have joined protests in over 100 cities throughout Brazil in the past few weeks. Since their early beginning as a “Revolta do Busão" (Bus rebellion) to reduce bus fares, the protests now include a much larger set of issues faced by Brazilian society. Protesters are angry about corruption and inequality. They’re also frustrated about the cost of hosting the upcoming World Cup and Olympic Games in light of economic disparity and lack of high quality basic services. Yesterday, as Brazil defeated Spain to win the Confederations Cup final, police clashed with protesters near Maracana stadium for the second timein two weeks.
English translation of "vem pra rua" video, via Global Voices.
People turned to social media to share what they saw on the streets and invite others to join in the protests. For example, some of our most active Brazilian users of So.cl have been posting daily collages with images, links, and descriptions of the protests. According to a well-known polling company, a surprising 72% of Brazilians online supported the demonstrations, and 10% claimed to have joined the protests on the streets. For a while, leftist President Rouseff maintained a high approval rate of 55%, down from 63% the year before and still one of the highest for any leader in the world. By June 29th, however, only only 30% of Brazilians considered her administration “great" or “good."
 
One of the collages on So.cl narrating the Brazilian protests
Timeline
Although the Brazilian movement seemed to appear out of the blue the second week of June, the news about the bus fare increase first appeared in the media back in January. Furthermore, the organization behind the first protests,Movimento Passe Livre (Free Pass Movement), started 8 years ago and had organized an initial demonstration with students on May 28th in preparation for a bigger one on June 6th that attracted a few thousand people. At that point, the protest’s presence on social media seemed to have been constrained to MPL’s blog and the Facebook event for the demonstrations. This changed after the demonstrations were faced with police repression and several videos of people being injured by police were spread on social media. The movement started to gain a lot of attention on Twitter and Facebook and quickly spread to more Brazilian cities. See the following timeline for a longer list of events related to the protests.
Measuring Twitter Activity in the Brazilian Protests
In order to better understand the development of the protests in social media, Twitter in particular, we collected the full set of 1,579,824 tweets posted between June 1st and June 22nd containing the following hashtags: #VemPraRua (Come to the streets), #MudaBrasil (Change Brazil), #ChangeBrazil, #ChangeBrasil, #passelivre (Free Pass), #protestosrj (Protests Rio de Janeiro), #ogiganteacordou (the giant awoke), #copapraquem (Cup for Whom), #PimientaVsVinagre (Pepper vs Vinager), #sp17j (Sao Paulo June 17), , #consolação, and #acordabrasil (Wake Up Brazil).
 
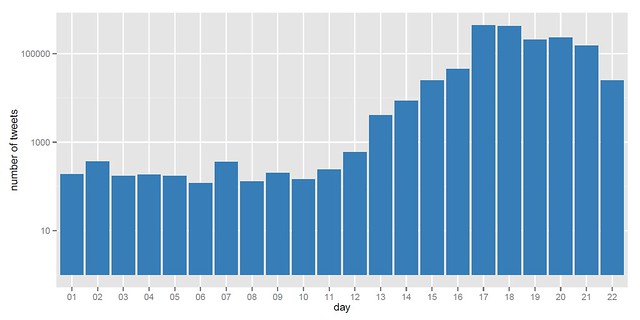
Tweets per day
Above we show the total number of tweets posted each day. We continue to analyze the data, hoping to expand beyond those hashtags, but here are three things we have found so far:
1. Protests’ tweets peaked on June 17th
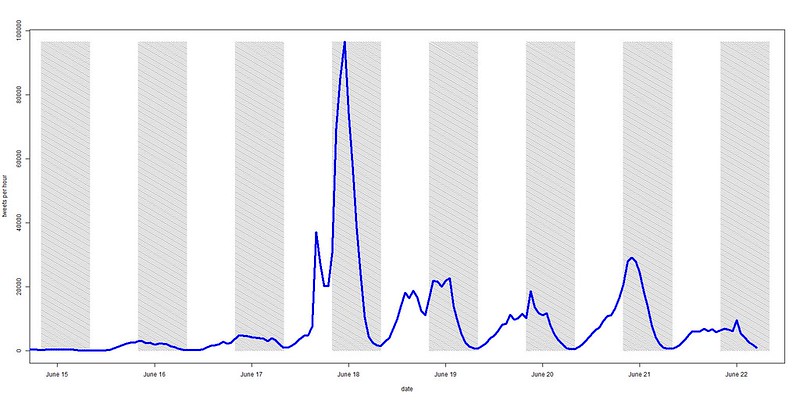
The peak of 96,531 tweets/hour happened specifically around 8PM local time on June 17th, 2013. This was the day protesters swarmed the Brazilian Congress. One example of a highly retweeted message this day was one from@AnonymousBrasil reporting on the protesters’ occupation of congress:
 
Tweets per hour - June 15th to 22nd
In the figure above, we show the hourly rate of tweets during the period of interest. Time of day seasonality is clearly visible as well as the dramatic spike in conversation on the night of June 17th. We also look at what is being talked about on Twitter. Below are some of the most commonly used words.
 
Most common words in the tweets of June 17th
2. International nature of protests.
Half of the tweets came from users whose time zone is set to “Brasilia” while the rest came from a wide range of other locations. The top time zones outside Brasilia were: Santiago, Greenland, Mid-Atlantic, Hawaii, Quito, Atlantic Time (Canada), Eastern Time (US & Canada), London, Pacific Time (US & Canada), Central Time (US & Canada), Istanbul and Buenos Aires.
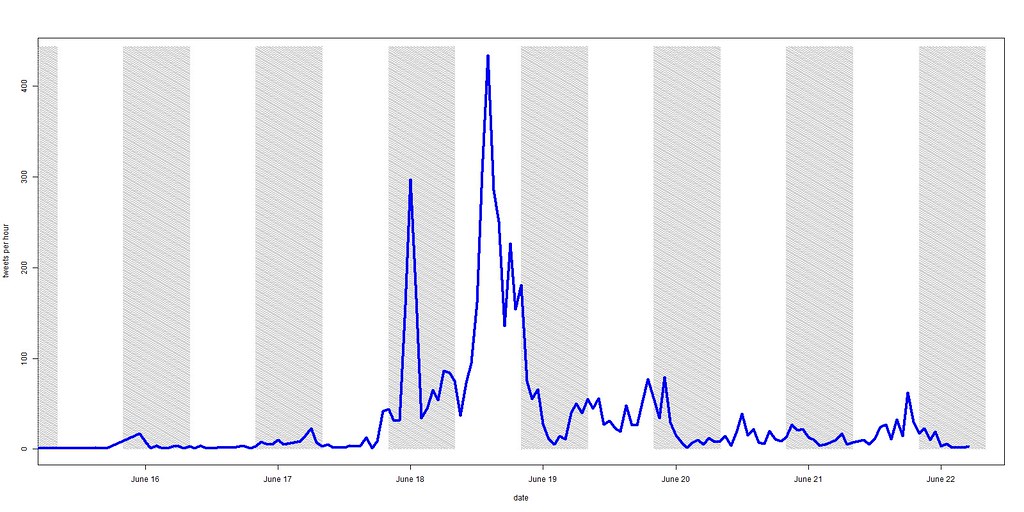
The relatively high proportion of users from Istanbul was particularly interesting given the similar protests going on in Turkey. The actual number of tweets from Istanbul was very small (5,582 tweets posted by 3,517 different accounts), but conversation rates follow a pattern of delay compared to the bulk of the tweets, suggesting that the tweets coming from Istanbul were posted after hearing the news of what was going on in Brasil (the tweets from Istanbul peaked at 434 tweets/hour on June 18th at 2:00 PM UTC) as seen in the figure below.
 
Tweets per hour from users whose time zone is “Istanbul” - June 15th to 22nd
 
The sign says “Turkey is here”, by Juliana Spinola via Demotix
3. Interactions network returns to its beginning.
Perhaps the most fascinating finding is that the structure of the interaction network among the most active users—defined by the @mentions and retweets among the top 1% of users (those who posted at least 20 tweets in total)—exhibits cyclic behavior over the week. The interaction network begins very sparse on June 15th, grows to be more dense on June 17th, and maintains this increased density for a few days before returning to a density similar to its starting point on June 15th. The following plot shows how the volume of interactions among those in the 99% quantile grows and then shrinks.
 
Shapes of interaction networks over the course of 8 days (June 15th to 22nd)
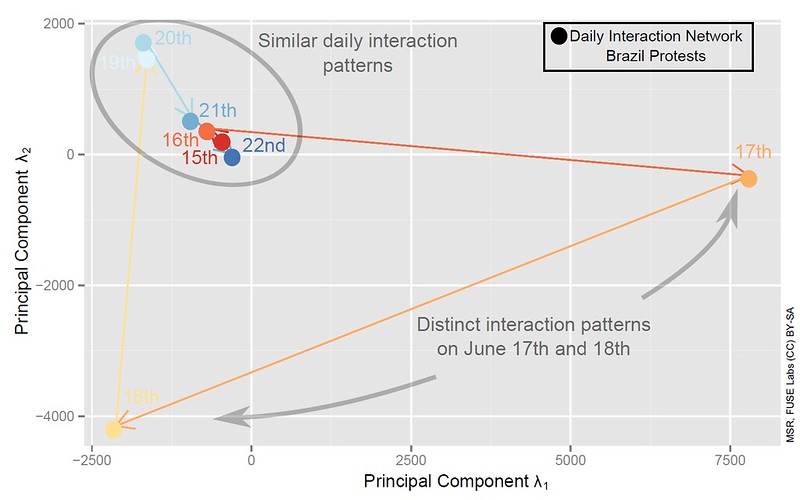
Moreover, by comparing the structure of these daily interaction networks, we find that the pattern of relationships also exhibits cyclic behavior. In the second plot we show each daily snapshot of the interaction network as a point in space. The distance between points (i.e. daily interaction networks) represents the structural similarity between those networks - pairs closer in space are more similar. The plot demonstrates how the interaction network among these individuals begins in a particular configuration on June 15th/16th before changing drastically on June 17th and 18th (individuals on these days are interacting with many new contacts, with whom they did not previously communicate). By the end of the week, the network returns to a structural configuration similar to the way it began on June 15th.
 
Network structural dynamics diagram. Each circle represents a daily snapshot of the interaction network. The distance between points (two daily networks) represents their similarity - pairs closer in space are more similar.
Future work
This initial analysis represents an quantitative analysis of the movement’s communication on Twitter using a specific set of hashtags. More work needs to be done to not only expand to the list of hashtags beyond those we used but also to look into other communication channels such as Facebook and face to face interactions.
Future questions to investigate could focus on understanding the roles of each of those channels. Beyond that, the roles and motivations of different actors including unaffiliated individuals, students, and existing political organizations such as MPL, traditional political parties, and collectives like Anonymous.
Thanks to J. Nathan Matias for his valuable feedback during the writing this post, and Andrew Osborne for the help with some of the visuals.