Increasingly I find myself creating Twitter hashtag archives using my TAGS Google Spreadsheet template as a means to identify who in that community has the most influence and ultimately use this intelligence to target people that might be able to help me disseminate my work. Marc Smith at the Social Media Research Foundation has a useful overview on ‘How to build a collection of influential followers in Twitter using social network analysis and NodeXL’.
I don’t go to the extreme of seeking people to follow and gaining influence with retweets, I usually just follow interesting people who follow me, but the post introduces the important concept of:
“betweenness centrality” – a measure of how much a person acts a bridge between others.
(betweenness centrality (BC) was a big turning point in my interest and understanding of social network analysis, a moment captured by Sheila MacNeill)
To date the only way I could calculate BC on an archive of tweets was to download the data to my desktop, run it through NodeXL and review the data. This isn’t ideal as the data becomes orphaned. I have experimented with calculating BC using Google Apps Script using a modified version of some PHP code put together by Jonathan Cummings, but kept hitting timeouts before I could get anything back.
I forgot about pursuing this angle until that is I saw Tony Hirst’s A Quick View Over a MASHe Google Spreadsheet Twitter Archive of UKGC12 Tweets in which he uses the statistical computing and graphing tool ‘R’ to read a spreadsheet of archived tweets and produce some quick summary views (I highly recommend you read this post and also check the contribution from Ben Marwick in the comments). Reading this post made me think if it is that easy to read and analyse data using R could you also not somehow push the results back.
Fortunately, and I do mean fortunately, I have no experience of R, R Script, R Studio (I like having no preconceived ideas of what new tools can do – it far more rewarding to throw yourself into the unknown and see if you make it out the other side), but I do know a lot about Google Apps Script giving me a destination – just no way of getting there.
The idea, I think, is ingeniously simple. Read data, as Tony did, process it in R and then using Apps Script’s feature to be published as a service to simply POST the data back to the original spreadsheet.
As that is quite complicated I’ll recap. Fetch a Google Spreadsheet as a *.csv, do something with the data and then push the data back in the same way that you post a web form (and if you skipped the link the first timePOST the data back to the original spreadsheet).
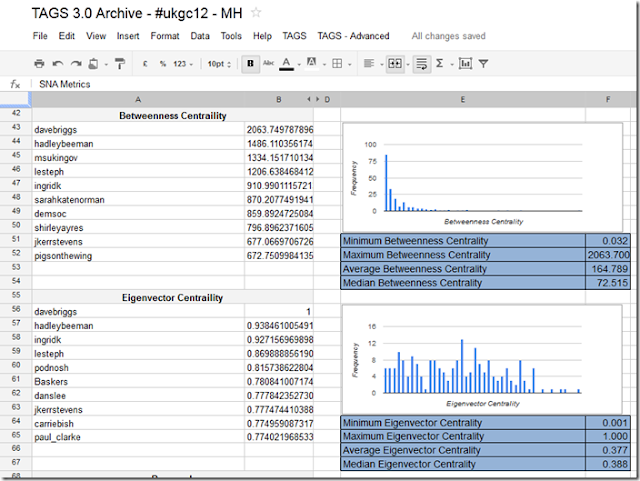
Having sunk a day of my own time (and it is my own time because I get paid for the OER Visualisation project for the hours I work on it), I’m not going to go into the details of how to setup R (or in my case RStudio) to do this – hey I learned it in a couple of hours so can you – instead I’ll give you the bits and pieces you need and general instructions. Before I start you might want to see if the result is worth it so here’s a sheet of SNA stats for the #ukgc12 archive.
Playing with some test data
To make it easier I start with a partially complete dataset. The scenario is I’ve got my archive and run options 1-3 in the TAGS – Advanced menu to get an Edges sheet of friend/follower information.
- Open this Google Spreadsheet and File > Make a copy (this is a fully functioning – if I haven’t broken it of the next version of TAGS so if you clear the Archive and setup you can start collecting and using this with your own data).
- Once you’ve copied select File > Publish to the web and publish the spreadsheet
- In the new spreadsheet open Tools > Script editor.. and Run > Setup (this get a copy of the spreadsheet id need to run as a service – in the normal scenario this is collected when the user authenticates the script with Twitter)
- Open Share > Publish as service.. and check ‘Allow anyone to invoke’ with ‘anonymous access’, not forgetting to ‘enable service’. You’ll need a copy of the service URL for later on. Click ‘Save’

- Back in the script editor on line 57 enter a ‘secret’ – this will prevent anyone from uploading data will in anonymous mode (you can choose to only enable the service when required for extra security.
- Open your install of R and load a copy of this script.
- There are four things to edit in this script
- key – spreadsheet key, the bit after https://docs.google.com/spreadsheet/ccc?key= and before the &hl… junk
- gid – the sheet number of the Edges sheet, unless you insert/use a different sheet should always be 105 for a TAGS spreadsheet
- serviceUrl – the url you got in step 4
- secret - the same secret you entered in step 5
- You might also need to install the packages used – most of them are standard but you may need to get igraph – used to get all social network data
- Run the R script – it may take some time to read a write to Google Spreadsheets so be patient
That’s it. If you go back to the spreadsheet (you may need to refresh) the SNA Metrics and Vertices sheets should be populated with data generated from R
The Apps Script Magic
Here’s the Google Apps Script snippet used to handle the data being pushed from R:
| 1234567891011121314151617181920212223242526272829303132333435363738394041 |
|
I’ve commented most of it so you can see what is happening. While Apps Script has a debugger which lets you monitor execution and variables it can’t intercept the POST so I used the original POST/GET code to dump the data into some cells then tweaked the script to read it from there to work out what needed to be done.
Final thoughts
I think this is a powerful model of reading selected, processing and then uploading data back to the source. I’m also only using the very basics of igraph and sure much more could be done to detect neighbourhoods, clusters and more. Also I wonder if more of the friendship data collection could be done in R with the TwitteR – (you R people really know how to make it hard to find info/help/support for your stuff ;) Right now I can get friend/follower info for a list of 250 users.
The intriguing aspect is just how much data can you push back to Apps Script and as there is a long list of Services could you also handle binary data like chart images (perhaps down the Blob and then Document Service route, or maybe just straight into Charts).
I welcome any comments you have about this technique and particularly value any feedback (I’m not a SNA expert so if there are errors in calculation or better measures I would welcome these)
No hay comentarios:
Publicar un comentario